




IoT & telemetry
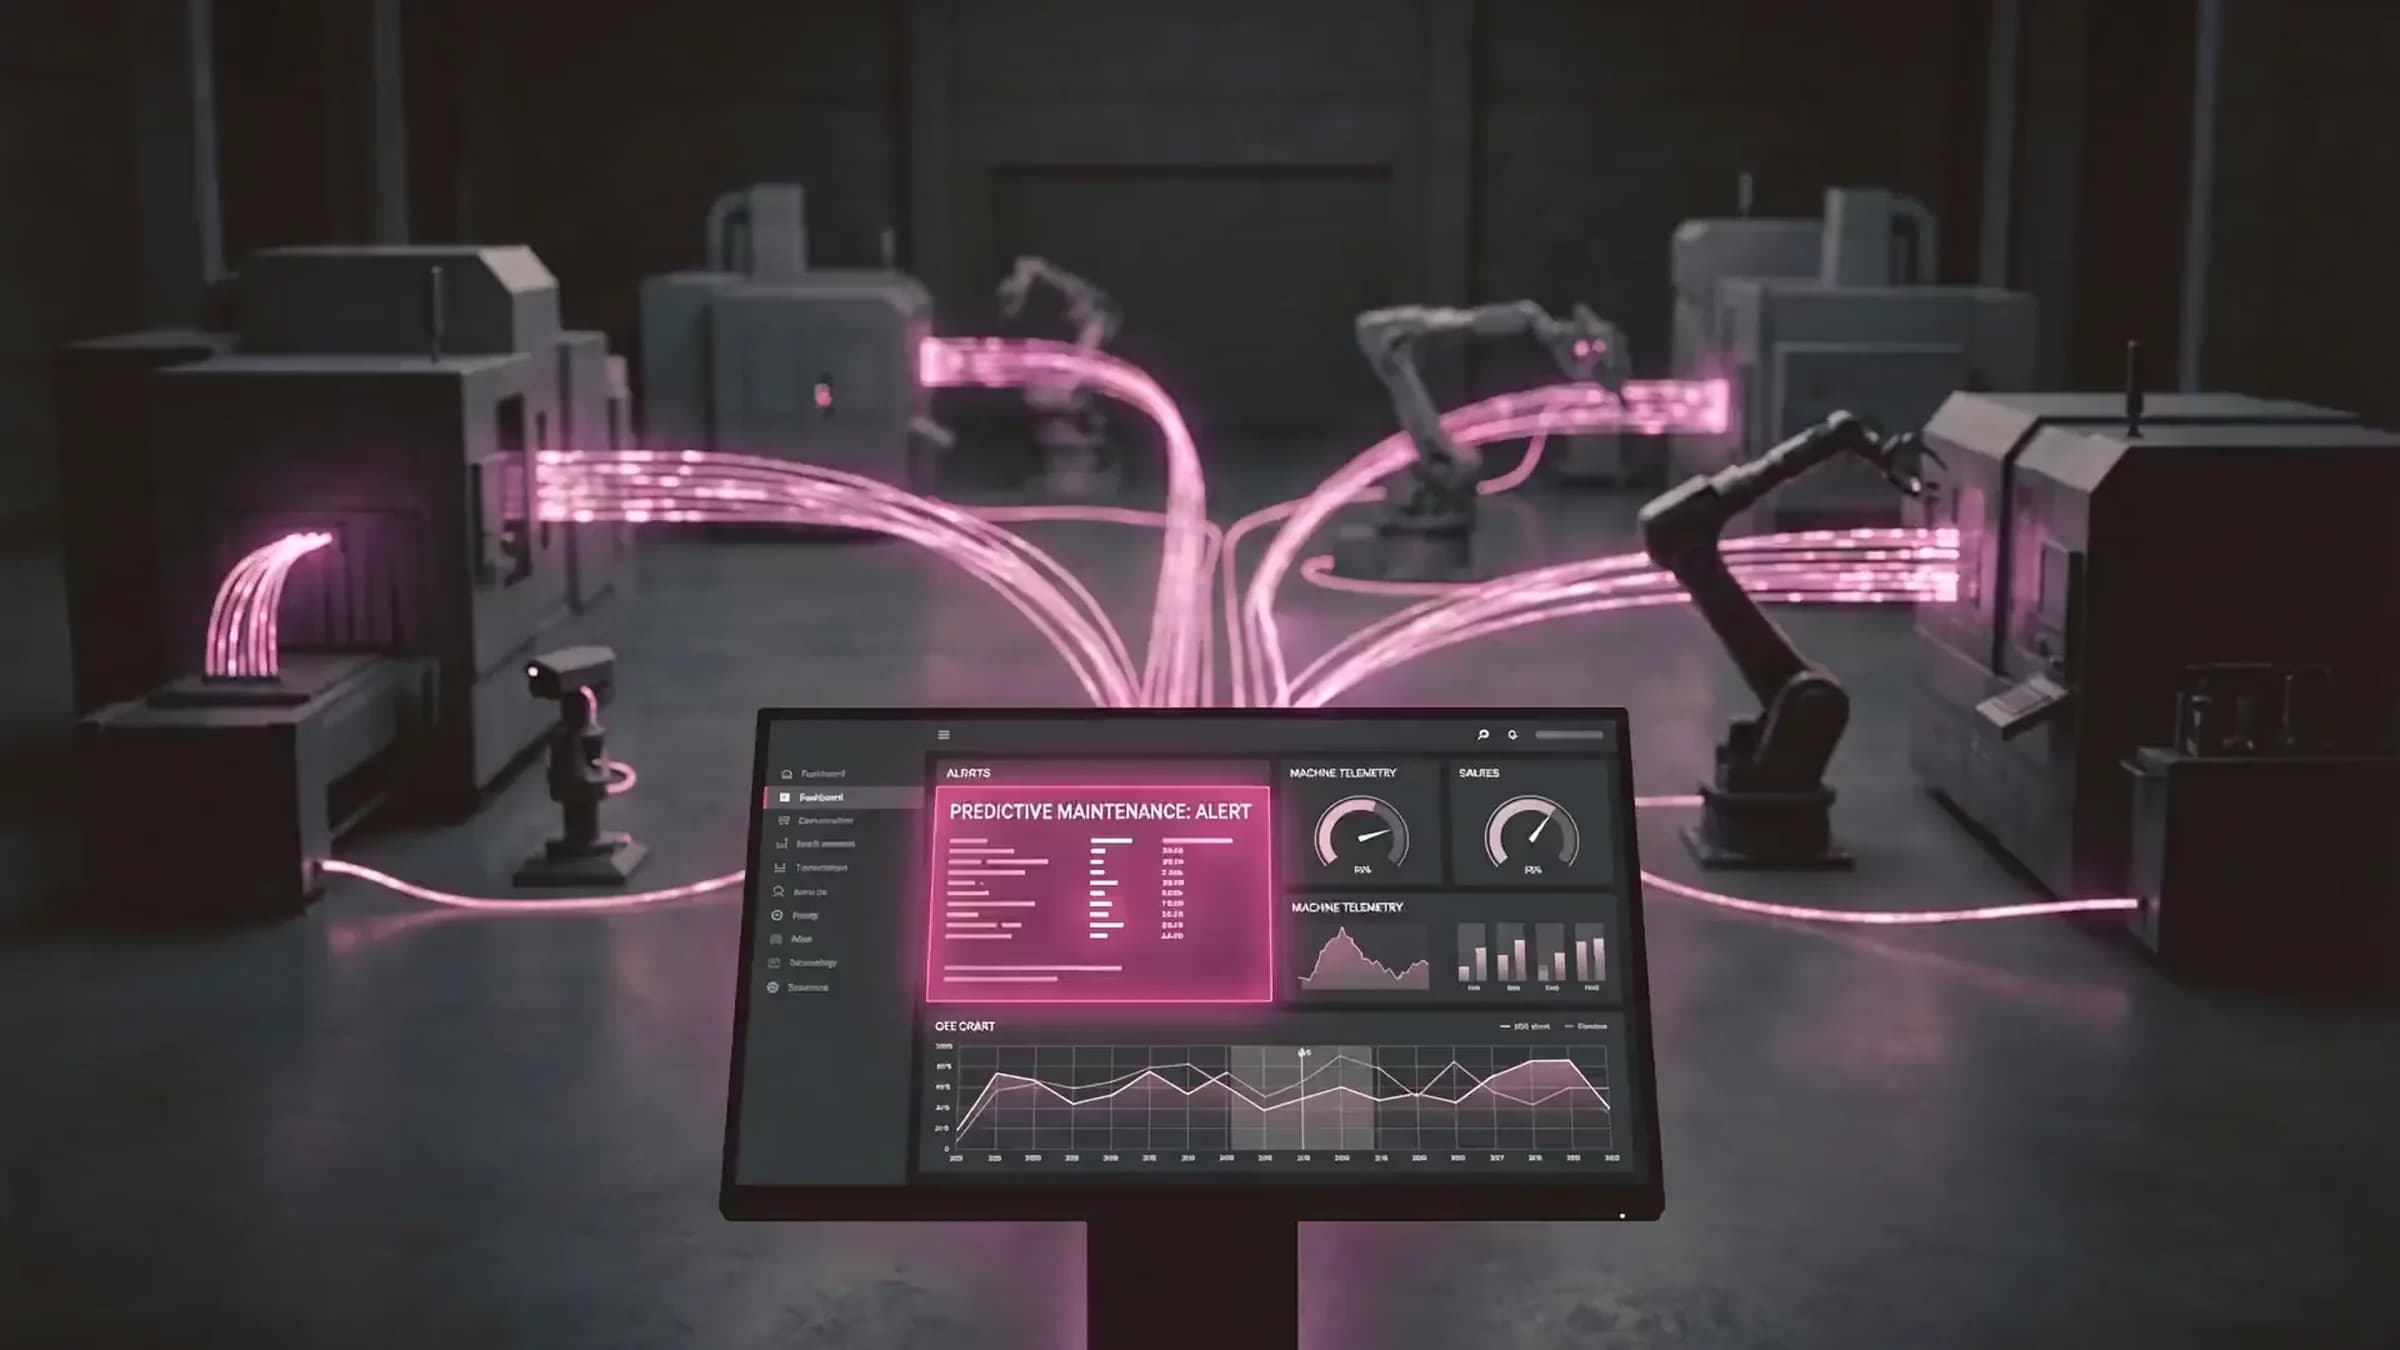
Device telemetry you can act on, including the part where a device goes quiet. The hard problem in IoT is never the message that arrives; it is knowing that a unit which should have reported ninety times today has reported four, and nobody noticed.
- QuietDetected, not missed
- OrderOut of order is fine
- TiersHot, warm and cold
- OTAUpdates with rollback
Sectors that trust us
What is telemetry?
Telemetry work is receiving readings from equipment you do not control, storing them affordably, and turning them into something a person acts on. The volume is rarely the difficulty. The difficulty is that devices lie, repeat themselves, arrive out of order and go silent without announcing it.

- Platform or build it?
- A vendor platform is the right answer at low device counts and a fixed protocol, and we will say so. It stops fitting when the monthly cost per device overtakes the engineering, or when your alerting needs context it cannot express.
Key takeaways
Silence is an event: a device that goes quiet raises an alert by itself, within its expected interval.
Replays are harmless: readings arriving late or twice never corrupt a total, because each one carries its own key and device timestamp, so a replayed batch changes nothing.
Storage is tiered: full resolution for weeks, aggregates for years, so history costs what it should.
Rules carry context: a threshold alone never pages anyone; the business reason for the alert does.
Why pilots stay pilots
Where telemetry stops scaling, and how we build it.
How they stall
Silence looks identical to a healthy zero reading.
A replayed message is double-counted in the totals.
Every reading is kept forever, at full resolution.
Firmware goes to every unit at once, and hopefully works.
How we build
An expected reporting rate per device, always monitored.
Readings are keyed, so a replayed batch changes nothing.
Hot, warm and cold tiers, with the retention agreed.
Firmware in waves, each with its own rollback.
What we build
Telemetry built for the moment a device goes quiet and nobody notices.
Each of these assumes the device is unreliable, which is the only safe assumption, so a reading that never arrives is as visible on the screen as a reading that is wrong.
Ingestion
MQTT or HTTP at fleet scale, with back-pressure and buffering instead of messages silently dropped under load.
Liveness tracking
An expected reporting rate per device, so silence becomes an event with a timestamp.
Time-series storage
Tiered and aggregated, with the retention agreed up front rather than discovered on a bill.
Alert rules
Thresholds plus the business context that makes one alert worth waking someone for, and the rest worth a morning summary.
Operator screens
The whole fleet at a glance, and any single device in full detail when it matters.
Firmware delivery
Rolled out in waves, health checks between them, and a rollback that has been run on purpose.
AI agents · on the fleet
Agents watching the fleet, speaking when it matters.
A model reads the stream alongside the rules: it notices a compressor whose vibration has drifted for a week, groups forty related alerts into one incident, and writes the morning summary in Arabic and English. It never acts on the floor; it proposes, and a person decides.
Drift, not just limits — a slow change over days is caught before any fixed threshold would fire.
One incident, not forty — related alerts are grouped and explained, with the likely cause named first.
Proposes, never acts — every action on equipment is a suggestion a named person approves or declines.
Devices, gateways and protocols mapped, with the message shape agreed with the hardware supplier.
The telemetry stack
No vendor lock-in, on your own cloud.
- MQTT
- Kafka
- TimescaleDB
- InfluxDB
- Grafana
- Node.js
- Python
- Kubernetes
- AWS IoT
- Azure IoT Hub
How it works · our method
The SiaSol five-phase method, applied to this service.
- 01
Discover
Most technology projects fail long before the first line of code — they fail at the question.
- 02
Diagnose
Every slow process has an owner and a cost.
- 03
Design
Architecture is a set of decisions you live with.
- 04
Deliver
Software not in production is just cost.
- 05
Evolve
The handover is the point, not the end.
Where we work
Close where it counts, bilingual everywhere
Egypt: Cairo (HQ) and nationwide delivery
Saudi Arabia: Riyadh, with teams on client time zones
Gulf and beyond: Arabic and English, one delivery standard
Cost & engagement
Telemetry platforms: what a rollout costs, and how we engage
Cost follows the message rate and the retention you choose, and the second one compounds month after month. We quote a pilot on a real subset of the fleet before anyone talks about the whole of it.
- Fixed · four to six weeks
Fleet pilot
A real subset ingesting, with liveness tracking and alerts.
- Per phase · quoted from the pilot
Full rollout
The whole fleet, with firmware delivery and operator screens.
- Monthly · dedicated
Embedded team
A standing team as the fleet and the rules keep growing.
FAQ
What to ask about IoT & telemetry.
01Which protocols do you support?
02How do you know a device went quiet?
03What about devices on bad connections?
04How long is the data kept?
05Can you push firmware to the devices?
06Should we use a vendor IoT platform?
07How do you stop alert fatigue?
08Do you work with the hardware too?
Related services
Often paired with this
- View
Applied AI
Models behind a real decision, with the evaluation to prove it.
Cloud, Data & AI - View
Cloud migration
AWS, Azure or GCP — with the bill modelled first.
Cloud, Data & AI - View
Data platforms
One place the numbers agree, and keep agreeing.
Cloud, Data & AI



Learn more
From the journal
- Engineering
What an integration actually costs
The API call is the cheap part. The expensive part is deciding what happens when it fails at 2am: who is paged, what is retried, what is written down and what is quietly dropped. A costing method that counts the failure paths first.
2026-09-09Read - Applied AI
The dashboard that nobody opens
Most reporting projects deliver screens, not decisions. How to tell which one you are buying before it is built: name the decision, name the person who makes it, and name what they would do differently once the number moves.
2026-08-26Read - Applied AI
Automate the decision, not the click
Robotic process automation copies a human, click for click, and inherits every reason the work was slow. Useful automation removes the reason the human was needed at all. How to tell the two apart before the first bot is bought.
2026-08-12Read







Ready to see which devices went quiet?
Tell us what the fleet reports today and what it should. We come back with a pilot on a real subset, a number and a date.
Book a pilot